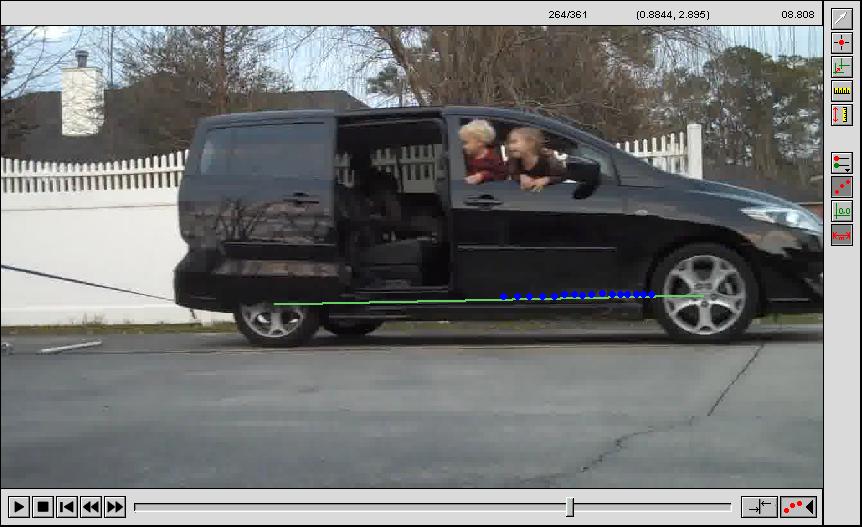
Over at Dot Physics, Rhett has been explaining the inaccurate calculation of power on a TV show that I have never heard of or had the chance to see. He posted a video of himself pulling the family minivan with the family inside. He even posted a video of his 6-year old pulling the vehicle!
I assume that in a future post, he'll be giving the right way to calculate the power, but I couldn't resist trying out video analysis in Logger Pro with his video.
I analyzed the first 3.5 seconds after the van starts to move by clicking on the same point on the van every few frames. I used the wheel base of the 2007 Mazda 5 as a guess for the scale calibration.
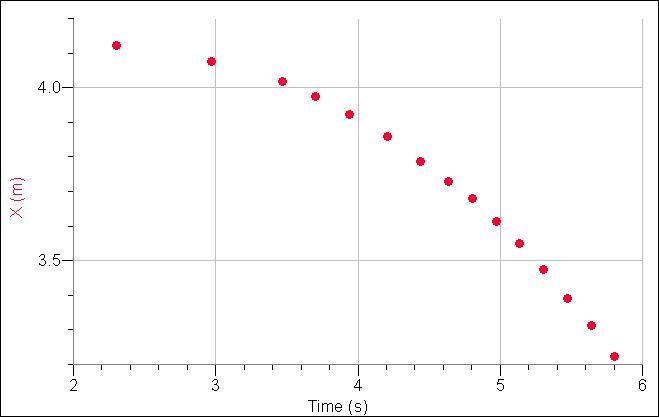
I was pretty surprised that on my first attempt, the position-time data had a nice parabolic shape. I could have probably spent a little more time making sure that I always clicked on the exact same spot on the van, but for quick and dirty analysis, I'm pretty happy. Logger Pro defaults to motion to the left as having negative velocity. I didn't really try to reset this, as I only care about the magnitude of the rate of velocity change (i.e. the acceleration).
The acceleration is the slope of the velocity-time graph, so let's look at that:
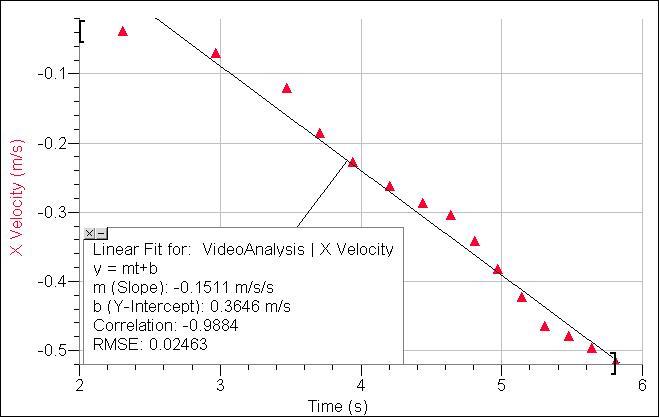 Okay, so Rhett either wasn't applying a constant force over the 3.5 seconds, or my measurement uncertainties are starting to show up. Either way, the average acceleration can be estimated by looking at the slope of the best fit line. Logger Pro says that the average acceleration was 0.15 m/s2.
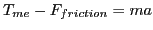
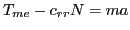
So, using Rhett's free body diagram, we can apply Newton's second law:
 |
  |
 |
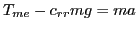
I googled around a bit and found that a typical auto on concrete has a coefficient of rolling resistance between 0.010 and 0.015, so I ballparked it at 0.012. Rhett gave the mass of the car in pounds, so I converted to kilograms.
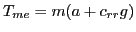
Finally:
 |
So the work done by our professor is equal to the force applied (300 N) multiplied by the distance through which the force acted (4.57 m). His power output during the pull is the work done divided by the time:
300 N * 4.57 m / 7.8 s = 176 W
That's a mighty bright light bulb, but it's just under twice the power radiated (on average) by a human that is just standing around doing nothing.
I know he was pulling at an angle, so his applied force is larger by the cosine of the angle, which I guesstimated to by 15 degrees, so make the applied force 310 N and the power 182 W if you want to be nitpicky about it...
4 comments:
See how strong I am? This means, don't mess with physics dudes.
And yes, the units are strange. I did this to match up with the crazy ESPN Sport Science episode that I was attacking.
This is a pretty good analysis. 300 Newtons seems like a reasonable value - but the more interesting thing is the acceleration. I didn't even think about the idea that this would produce a pretty constant acceleration.
I don't know how long the (nearly) constant acceleration lasts. I was running out of time while working on the Logger Pro video tracking, so I gave up after I felt I had enough data.
The variations in the force graph display a periodicity of about 1.5 seconds, which appears to be about the length of time it takes to step with both feet.
I would hypothesize the variations in force are related to footfalls.
Humans evolved for walking because it is efficient, using a upside-down pendulum approach to convert potential energy into kinetic energy and then back again (as a pendulum does).
Something similar is happening here. One of his legs acts as a lever, with a fulcrum at the foot. As his center of mass lowers, that lever converts the potential energy of his hight into kinetic energy accelerating the car.
As he walks away, chemical energy in his muscles is converted into potential energy as he reestablishes the hight of his center of mass.
So, since his walking is a periodic process, with a varying output of kinetic energy, one would expect the car's rate of acceleration to be periodic.
Additionally, as the car accelerates, so too must the rate of footfalls (indeed, for the first couple of seconds he doesn't step at all) and so you would expect the periodicity of the output to cycle faster and faster as his steps become faster and faster.
And the second graph displays a lovely sine wave like curve, relative to the slope of acceleration, which increases in frequency over time. (Just as I would expect, if all of the above assumptions are true.)
It would be interesting to see how your data points compare to the position of his feet at that moment in time.
Actually, I'll bet plotting his center of mass would result in the same sine curve seen in the graph of the car's acceleration, or to a closely correlated sine curve.
I failed college physics BTW. Did fine with all the concepts but hated all the math.
That's an interesting idea!
I once heard a talk by someone who was developing a sensor to measure the motion of humans walking, and they were making use of the periodicity, similar to what you are talking about. So I don't doubt that there may be something to your observation and explanation.
I'm just concerned that my hasty clicking on the video may have introduced measurement uncertainties that would make any analysis of the oscillations somewhat ambiguous to interpret.
I should go back and see what the acceleration curve looks like. Thanks for the idea!
Post a Comment